Standardization Phase
Data Collection
Data collection for the standardization phase occurred between November 2015 and May 2016. Two normative samples (English Speakers [N = 1,530] and English Learners [N = 1,190]) were collected, and were evenly balanced across age groups (ranging from 2 years 6 months to 22 years 11 months) and genders. The English Speaker sample was stratified by geographic region, PEL, and race/ethnicity in accordance with U.S. Census populations for individuals who speak only English at home (United States Census Bureau, 2014). The English Learner sample was matched on geographic region, PEL, and language spoken, in proportion to individuals in the U.S. Census who spoke a language other than English at home (United States Census Bureau, 2014), along with an additional layer of stratification for length of exposure to English. Details about the inclusionary criteria and demographic distribution of the normative samples can be found in chapter 7, Standardization.
Performance on the 20 Screener items determined where in the test portion an individual would start. The Screener was developed to reduce the total number of items that examinees needed to attempt; it was intended to gauge their ability and to ensure that the items presented were at an appropriate level of difficulty for an individual examinee. The 20 items included in the Screener set were the 15 existing Screener items that were observed to have a very high proportion of correct responses within certain target age groups during the pre-pilot phase, and five items from the pilot version that were observed to have similar item properties. These 20 items were representative of various levels of performance for various age groups. The Screener items determined the appropriate starting point for each examinee, within age-related confines, to ensure sufficient normative data was captured.
The administration procedure of the assessment was consistent with that of previous versions, including the task instructions and the need for an examiner’s supervision at the data collection site.
In addition, reliability and validity studies were conducted during this phase. Results from a clinical validity sample, including individuals with language-related disorders and disabilities (N = 289, see Relation to Clinical Diagnoses in chapter 8, Test Standards: Reliability, Validity, and Fairness, for details about clinical subgroups), were collected, along with those from a test-retest sample who took the Ortiz PVAT at two time-lagged administrations. Data from two convergent validity studies were collected from 1) a sample of examinees who completed the Ortiz PVAT in conjunction with another measure of receptive vocabulary, and 2) a sample of examinees who completed the Ortiz PVAT in conjunction with a measure of verbal intelligence. These studies followed the same administration procedures as the standardization study. More information about these studies can be found in chapter 8, Test Standards: Reliability, Validity, and Fairness.
Analysis of Standardization Study Data
First, the item-level functioning of the 347 test items was investigated using similar analyses as in the pilot study phase. Relying on a mixture of methods from CTT and IRT, analyses included an exploration of the proportion of individuals who responded correctly (both in general, and as a function of age, length of exposure to English, and other demographic groupings), response distribution and distractor analysis, mean group differences, IRT discrimination and difficulty parameter estimates and characteristic curves, item information, and differential item functioning (DIF; for a detailed discussion on the topic of DIF, see Chalmers, Counsell, & Flora, 2016; Embretson & Reise, 2000; Stark, Chernyshenko, & Drasgow, 2004).
Using IRT, a dichotomous, unidimensional 2-parameter logistic (2PL) model with a fixed c (i.e., guessing) parameter was fit to the data. Guessing was fixed in this model to 0.20 to estimate the likelihood of randomly selecting the correct response among the four possible response options (although theoretically a pure guess amongst the four alternatives would be associated with a guessing parameter of 0.25, a slightly lower guessing parameter was used to reflect the fact that few items would be a complete random guess for most examinees). Items were retained if they met the following criteria:
a) a (i.e., discrimination) parameter estimates > 0.75
b) item information values > 0.30
c) balanced placement of b (i.e., difficulty) parameter estimates, with respect to other items to ensure varying levels of difficulty are assessed
d) unidimensional factor loadings > 0.32
e) item-level fit statistics indicating acceptable item fit to the model (S-X2 p > .05)
f) absence of DIF by gender, race/ethnic group, or language spoken (χ2 p > .05)
g) absence of mean group differences by gender or race/ethnicity (Cohen’s d effect size ratios < |0.20| or items in which the proportion of correct responses by group differed by fewer than 15 percentage points)
h) proportion of correct responses increases as exposure to English increases
i) absence of unusual response patterns by other demographic characteristics (e.g., geographic region)
j) absence of qualitative concerns from test examiners
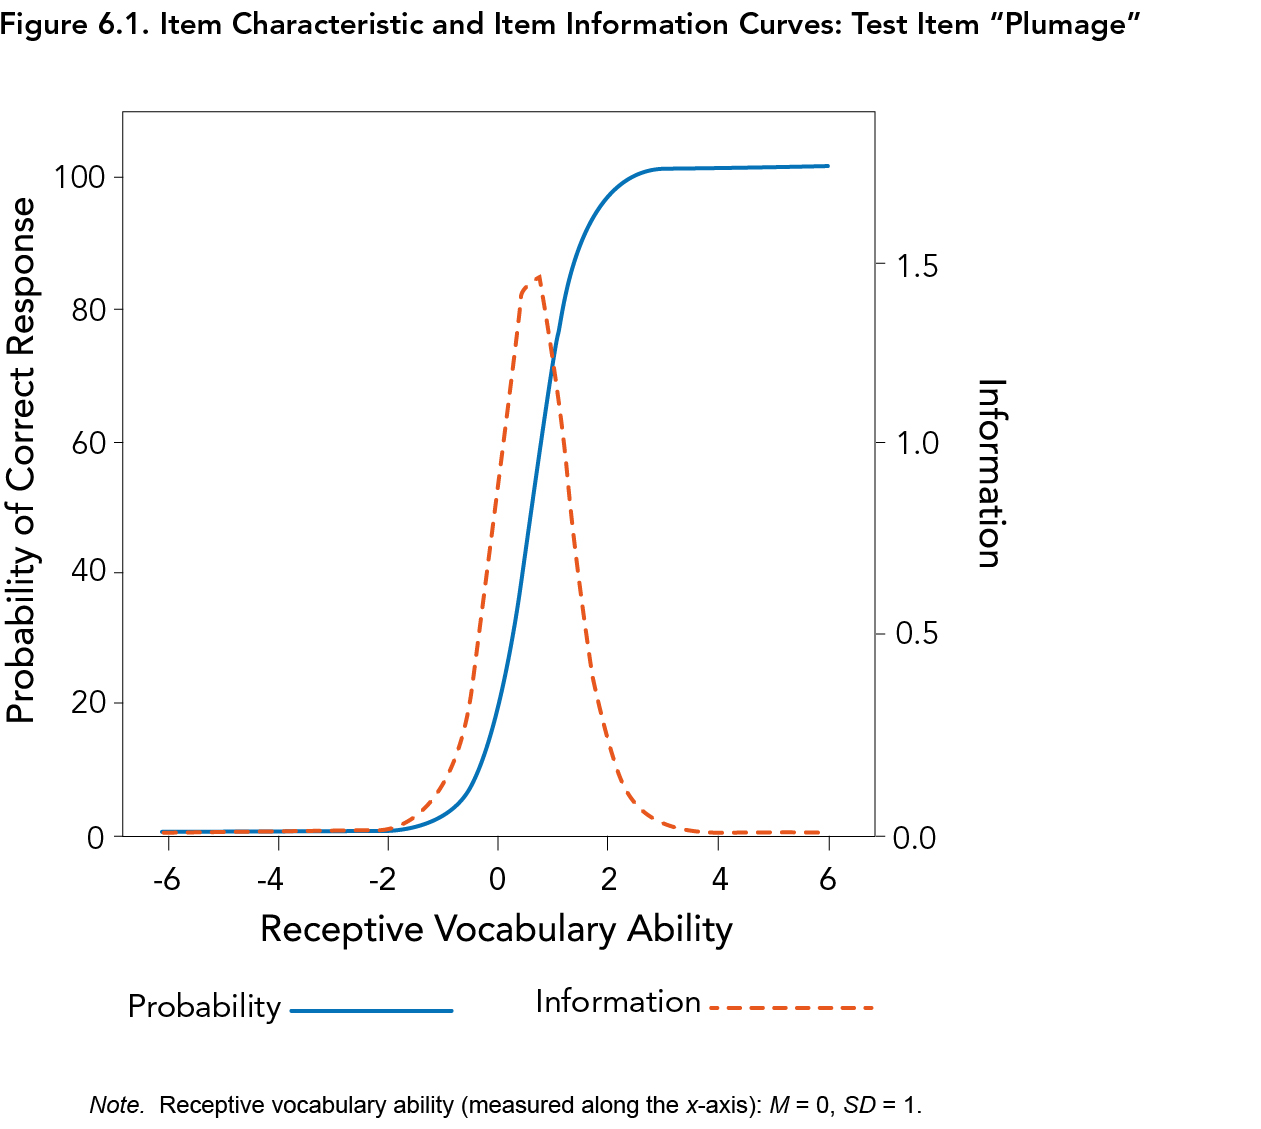
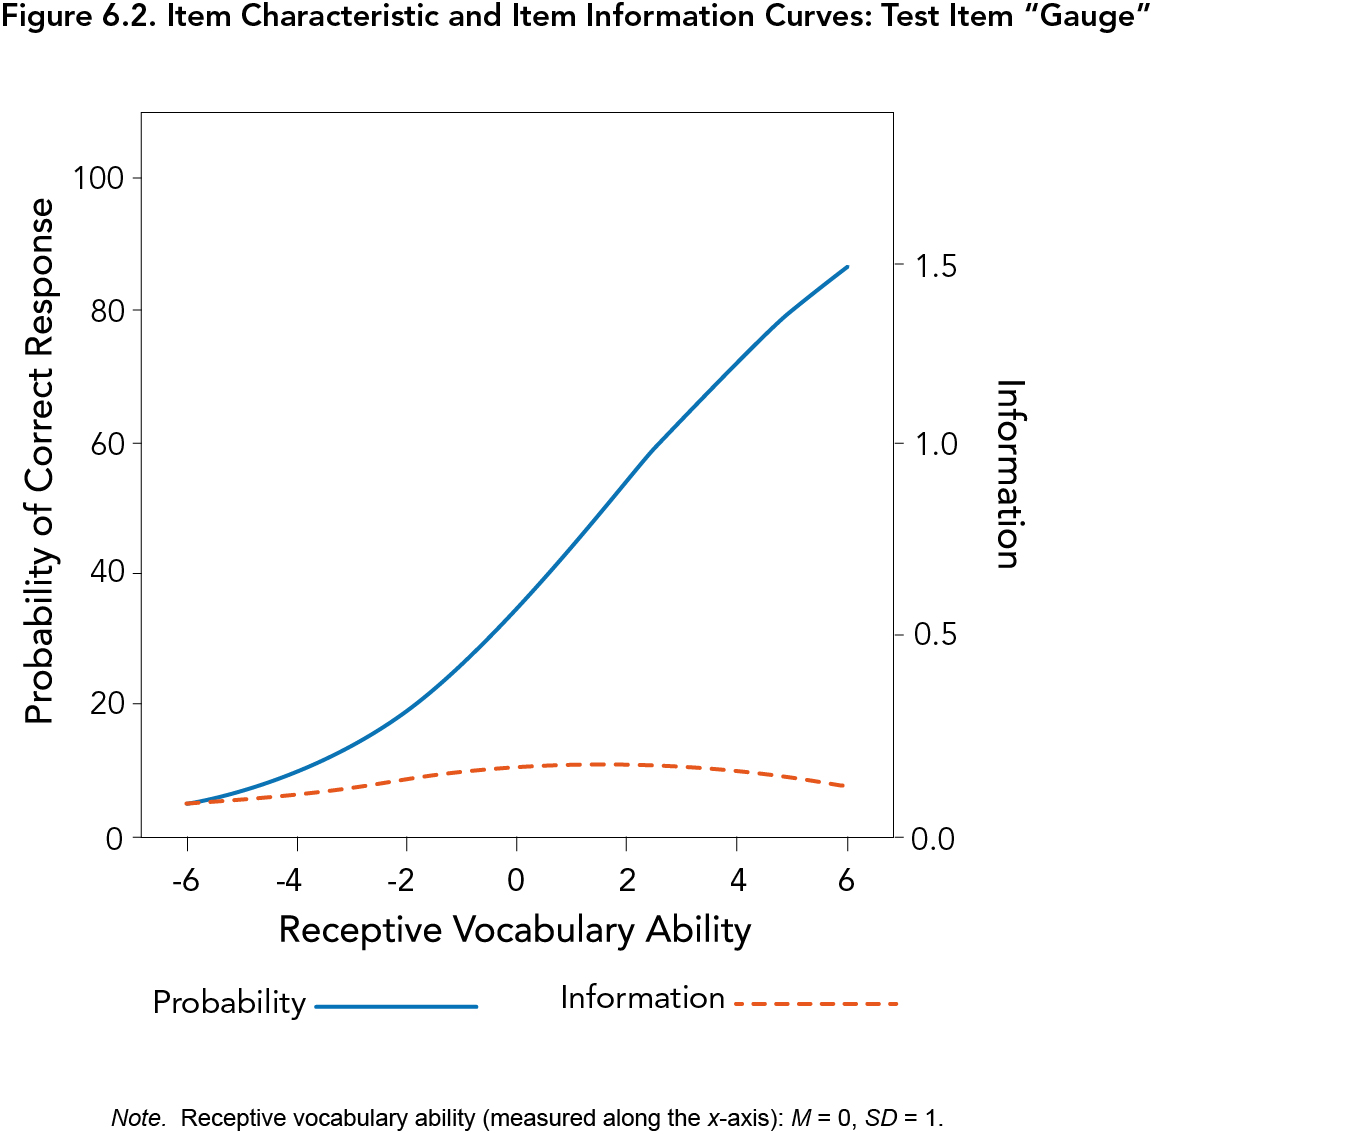
For example, Figure 6.1 depicts the item “plumage,” which appears on Form A of the Ortiz PVAT. Items with properties similar to the blue, solid line of Figure 6.1 were retained, as the item characteristic curve (ICC) has steep discrimination (i.e., a steep slope such that examinees of low ability have a very low proportion of correct responses, while examinees with high ability have a very high proportion of correct responses, as opposed to a gradual incline as ability increases) and is well-positioned in the target range of the ability being measured (i.e., within two or three standard deviations above and below the mean). The item information curve (denoted with the red, dotted line in Figure 6.1) also shows substantial information or precision. In contrast, items with IRT properties similar to the item “gauge,” as seen in Figure 6.2 (for example), were removed, as the slope of the ICC is much flatter, lacking a clear inflection point. The item information curve also depicts very little information afforded by this item (thereby indicating a high degree of error).
The IRT model was also used for the evaluation of item-level DIF to test for a lack of item-level measurement invariance between specified groups. Evidence of DIF is a necessary, but not sufficient, indicator of bias. The presence of DIF would indicate that important subgroups have different probabilities of correctly responding to an item, despite having the same amount of the underlying ability (Embretson & Reise, 2000). Such a result would mean that the item does not predict performance on the Ortiz PVAT equally well across groups. DIF is an especially useful tool as it can distinguish potential measurement bias from true mean differences by group (Stark, Chernyshenko, & Drasgow, 2004).
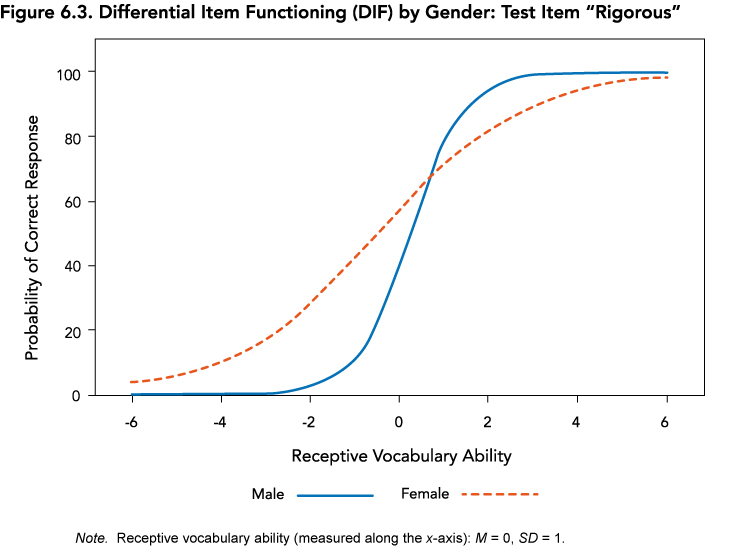
DIF was investigated by gender (male vs. female participants), language group (English Speaker vs. English Learner norm samples), and by race/ethnicity (White vs. Non-White, for the English Speaker normative sample only). Overall, only 13% of items displayed any evidence of DIF and were flagged for further review. Flagged items were then inspected for the type of DIF displayed (uniform—differences occurring in the difficulty parameter, and non-uniform—differences observed in the discrimination parameter), as well as the severity and potential for bias. For example, Figure 6.3 presents item characteristic curves for male and female participants for the item “rigorous,” in which statistically significant non-uniform DIF was observed. The slope of the line is steeper for female youth than male youth, indicating that the item distinguishes between high and low scores more effectively for female participants and that the item is more closely related to the construct of receptive vocabulary for female participants than it is for male participants. The item also appears to be easier for male participants than it is for female participants, as evidenced by the curve’s slight shift to the left for male participants (i.e., to the lower end of receptive vocabulary ability). These facts, when considered together, suggest that the item is functioning fundamentally differently for each gender, justifying the removal of this item and others with similar characteristics. DIF in less than 10% of the items on a test is typically considered tolerable (Embretson & Reise, 2000). Through the review process, items with DIF and other indicators of poor performance were removed, dropping the proportion of items with DIF concerns to less than 4%.
Items that did not meet the aforementioned criteria were reviewed by the development team, and poorly performing items were removed. The review process reduced the item pool to 292 items that met criteria for desirable performance. The IRT model was then recalibrated on the final set of retained items, and parameter estimates from the revised model were used in the final test construction phase.