Ortiz PVAT Scores
Raw Scores
Raw scores are computed as the sum of the items answered correctly throughout the test. Items prior to the starting point (i.e., bypassed items based on Screener performance) are scored as correct, and items beyond the stopping point (or ceiling) are scored as incorrect (for further information on the starting and stopping points, see chapter 3, Administration and Scoring; see chapter 6, Development). Raw scores are difficult to interpret, as the typical or expected number of correct responses varies by ability level, which, in turn, can be influenced by a number of other factors (e.g., age, grade, or length of exposure to English). Raw scores only convey information about the individual’s performance on the test in isolation of any reference to expected or typical performance. For interpretation purposes and to allow meaningful comparisons to others, raw scores are converted to standard scores.
Standard Scores
A standard score is used to compare an individual’s performance to a reference group. The standard scores used in the Ortiz PVAT have a mean of 100 and a standard deviation of 15 and follow a normal distribution. That is, most people (nearly two-thirds) in the normative sample score between 85 and 115 (±1 standard deviation from the mean), and very few people score in the extreme ranges. For example, a standard score of 144 is nearly three standard deviations greater than the mean of 100 and thus is statistically rare; it occurs much less than 1% of the time. Standard scores were derived separately for the English Speaker and English Learner normative samples (a description of these samples is provided in detail in chapter 7, Standardization; see chapter 6, Development, for details on the creation of scores from these normative samples).
Standard scores measure performance on the test, accounting for age and (in the case of the English Learner normative sample) length of exposure to English. For English speakers, a standard score of 100 reflects that the individual’s obtained raw score translates into performance that is typical of other individuals of the same age. For English learners, both the examinee’s age and length of exposure to English are factored into their standard score, such that their raw scores are compared to other individuals of the same age with similar exposure to English (e.g., a 10-year-old who first learned English at age 5 years and has been exposed to English for 50% of their life would be compared to other 10-year-old English learners who have also had 50% exposure). Ortiz PVAT standard scores range from 55 to 145; the range of scores has been truncated slightly such that the same range is applied for all normative groups. Scores more extreme than three standard deviations are rare and would not be interpreted differently for the intended practical applications of the instrument.
A continuous norming approach was used in calculating the standard scores, accounting for expected performance of individuals of the same age, as well as information about the performance of individuals across the whole age range. The rate of vocabulary acquisition can be more rapid and important to model when individuals are young or have low exposure to English. Once individuals reach conversational fluency, the functional implications of continuous vocabulary acquisition diminish somewhat, except in the educational context. Eventually, it becomes a more gradual process in older individuals or those with greater exposure to English. The standard scores were carefully designed to capture this important theoretical and empirical trend. Rather than creating scores that combine all individuals into a single group based on year of age (e.g., grouping all 5-year-olds together), scores are calculated based on the examinee’s precise age (e.g., 5 years 8 months old) to properly account for the development that happens over periods of time shorter than one year (Angoff & Robertson, 1987).
Another valuable property of standard scores is that they can be classified into categories to aid interpretation. For example, a standard score of 97 is classified as Average, indicating a typical level of receptive vocabulary ability. Classification categories range from Extremely Low to Extremely High. Even though classification labels are useful for summarizing results in a general sense, the boundaries of each category represent conventional guidelines and should not be used to form absolute rules or standards for cut-off scores. For example, standard scores of 69 and 70 fall in different categories (Extremely Low and Very Low, respectively), even though there is no significant difference between the two scores. It may be more helpful to describe such scores as being on the border or juncture of the two categories. Such an interpretation is consistent with the notion of confidence intervals, which are critical in describing test performance.
Confidence Intervals
A confidence interval is a band of error around an estimated true score (Nunnally & Bernstein, 1994). This band provides a range of standard scores, at a particular level of probability, within which the examinee’s theoretical true score could be expected to occur. All measurements contain some degree of error, despite best efforts to minimize it and mitigate associated risks. This type of unavoidable error is particularly true in cases where the measured construct is latent and not directly measurable, or where it is impractical to measure the construct because of its sheer magnitude (e.g., individuals who have fully acquired their vocabulary repertoire). Error, as measured by the standard error of measurement (SEM), was used to compute 95% confidence intervals for both the English Speaker and English Learner normative samples (see chapter 8, Test Standards: Reliability, Validity, and Fairness, for more information about the calculation of confidence intervals). The result is that for all standard scores (i.e., for English speakers and English learners alike, and for both Form A and Form B), the lower limit of the confidence interval is 4 points below the standard score, and the upper limit of the confidence interval is 4 points above the standard score. For example, the 95% confidence interval around a standard score of 88 is 84–92. This interval indicates that the individual’s true standard score (i.e., their actual level of vocabulary acquisition) will fall between 84 and 92 about 95% of the time if it is measured repeatedly. Thus, the confidence interval for a standard score informs evaluators of a narrow range of scores that are most likely to capture the examinee’s true level of receptive vocabulary acquisition. As noted, the confidence interval is especially important to consider for scores that are close to a boundary between classification categories. For example, an examinee who obtains a standard score of 88 (which is in the Low Average range) would have a true standard score that could range from 84 to 92 (the upper boundary of which would be classified as Average).
Percentile Ranks
Percentile ranks are extremely valuable in understanding an individual’s performance relative to other people. A percentile rank indicates the proportion of other individuals of the same age (and length of English exposure for the English Learner norms) who are at either the same level of ability or attribute, or lower. Specifically, the percentile rank ranges from 1 to 99 and indicates the percentage of individuals in the normative sample who scored the same as or lower than the examinee, based on a theoretical normal curve. For example, if an examinee’s standard score places them at the 48th percentile, this means that 48% of individuals in the normative sample are also expected to have earned a score of the same value or lower. Percentile ranks are provided for every standard score. The conversion from standard score to percentile was based on a standard normal distribution, yielding theoretical percentiles. Theoretical percentiles describe the cumulative probabilities of each score from a normally distributed population, while empirical percentiles describe the frequency of occurrence of scores within a given sample and are more affected by sampling variability. Theoretical percentiles were selected for the Ortiz PVAT, as the standard scores are normally distributed.
Note that differences in theoretical percentile ranks do not have the same meaning across the entire range of scores, which is in contrast to standard scores. For example, the eight-point difference between the percentile ranks of 90 and 98 is represented by a greater distance across the distribution of the normal curve (as reflected in the 11-point difference between the corresponding standard scores of 119 and 130) compared to the eight-point difference between the percentile ranks of 50 and 58 (as reflected in the three-point difference between the corresponding standard scores of 100 and 103). With such considerations in mind, percentile ranks are most useful for describing how an individual performs in relation to others in the general population of the same age (and of similar exposure to English, for English learners).
Stanines
Standard nines, or stanines, provide another general framework for describing score performance, particularly for non-diagnostic purposes. Stanine scores categorize relative ranking into nine broad categories. They are derived from the normative samples and are a direct transformation of percentile rank scores. The mean stanine is 5 and the standard deviation is 2. Stanine scores between 4 and 6 are considered to be within the average range, while scores as low as 1 or as high as 9 are extreme. Stanines, while not as precise as standard scores or percentile ranks, can be used as simple boundary categories to broadly classify a large group. They are most appropriately used in a low-stakes testing scenario or when reduced measurement precision can be tolerated.
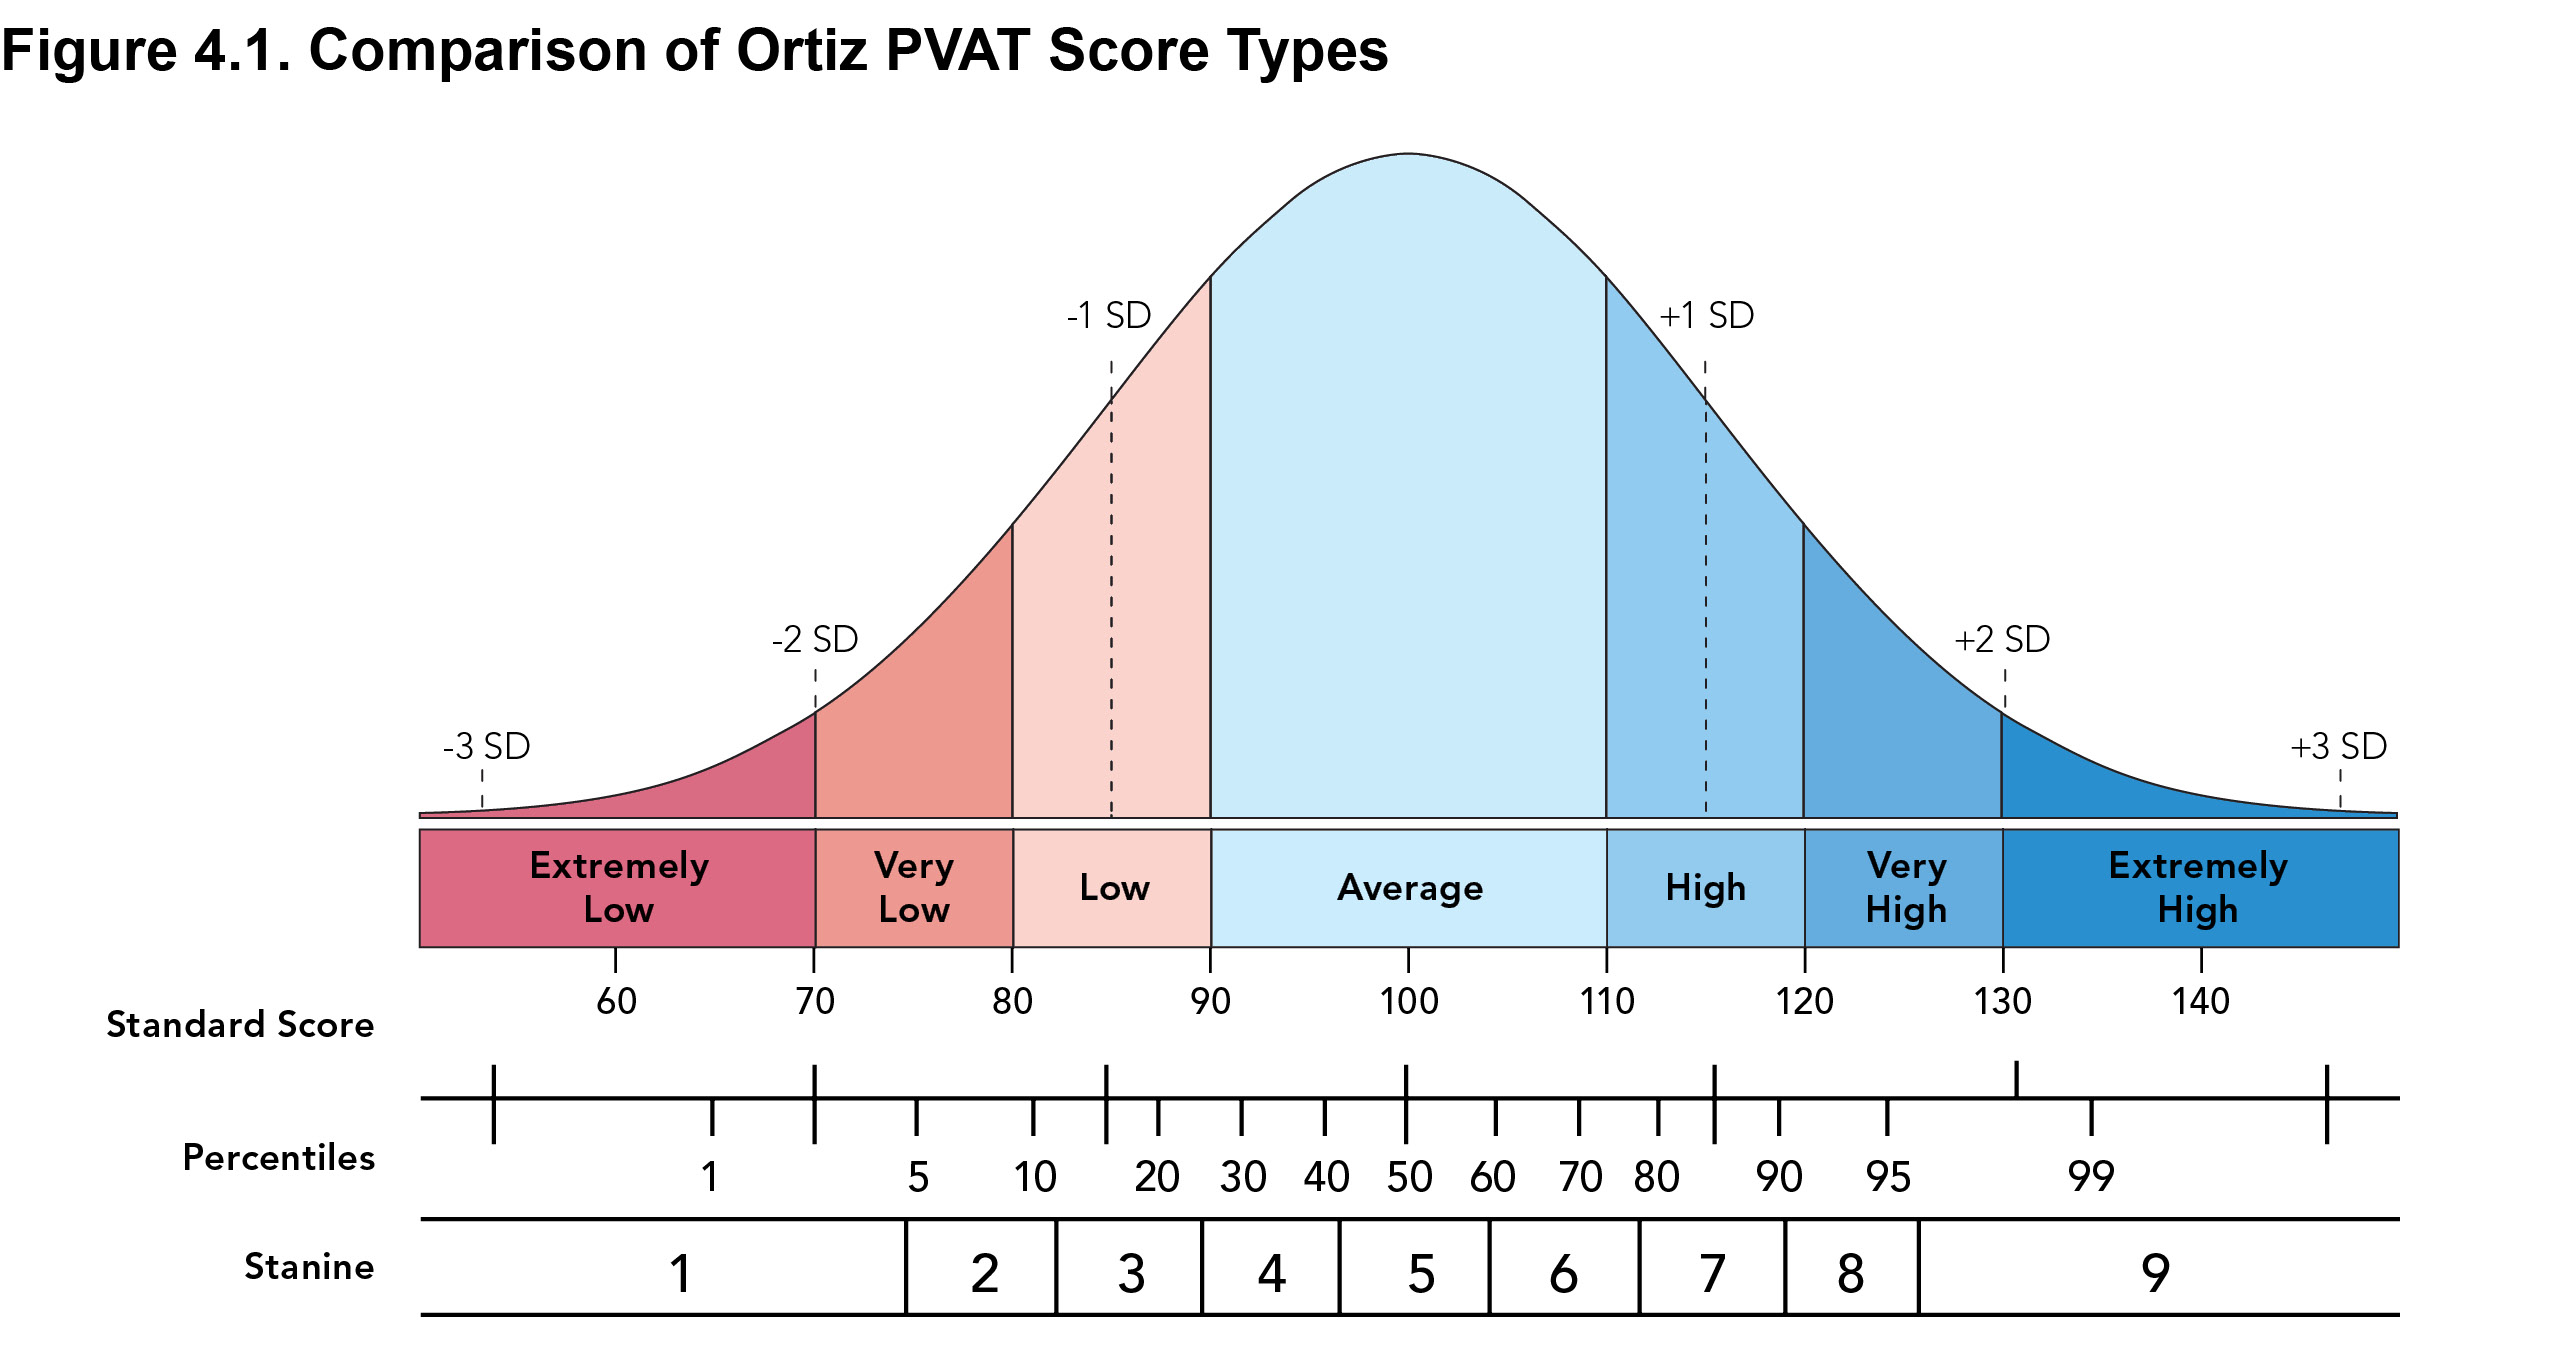
The relationship between standard scores, percentile ranks, and stanines is illustrated in Figure 4.1. As mentioned, scores of one type can easily be translated into scores of another type using the relative conversions as depicted in Figure 4.1.
Age Equivalent Scores
For English speakers, the age equivalent score represents the typical age (in years and months) at which a particular raw score is obtained within the normative sample. For example, when using the scoring methodology for the English Speaker normative sample, a raw score of 50 on the Ortiz PVAT is most closely associated with the expected mean score for individuals aged 4 years 9 months. Therefore, the age equivalent score for an examinee who receives a raw score of 50 will be 4:9 (denoted as years:months), irrespective of the examinee’s chronological age.
For English learners, the age equivalent score draws upon the scoring methodology used for the English Learner normative sample. That is, the age equivalent score represents the age at which a particular raw score is most likely to occur, given the individual’s length of exposure to English. For example, an English learner examinee who has been exposed to English for 15% of their life obtained a raw score of 50. The examinee’s age equivalent score is 6:6, because a raw score of 50 corresponds most closely to the mean score for other English learners aged 6 years 6 months with 15% exposure to English. However, if the examinee’s exposure to English was 75%, a raw score of 50 is now most closely aligned with the performance of examinees aged 5 years 6 months (i.e., age equivalent score = 5:6). Note that age equivalent scores for English learners specifically account for precise exposure to English.
Age equivalent scores are computed in intervals of three months (e.g., possible scores include 8:0, 8:3, 8:6, 8:9, but 8:10 is not a possible age equivalent score). The use of three-month intervals creates clear distinctions between the expected raw scores of each age group. The minimum and maximum values for age equivalent scores are ≤ 2:6 and ≥ 19:3, respectively. Despite the Ortiz PVAT age range that extends to 22 years 11 months (22:11), the maximum value for age equivalent scores is limited to 19:3 due to the plateau in the predicted mean raw scores (see Figures 7.1 and 7.2 from Standardization Procedures in chapter 7, Standardization). The expected scores for individuals up to age 19:3 demonstrate an incline, while scores for individuals between 19:3 and 22:11 appear flat when graphed. Because of this trend, the age equivalent scores do not distinguish between ages within this range and are reported as ≥ 19:3.
Age equivalent scores can be a useful metric for assessing relative performance. They are especially useful for age ranges in which receptive vocabulary is expected to grow more noticeably during early acquisition, given that vocabulary acquisition tends to plateau with increased age and exposure to English. However, proper interpretation of age equivalent scores is not always straightforward, despite its frequency of use and appearance on other assessments. If the examinee is close in chronological age to their age equivalent score, their performance on the Ortiz PVAT can be interpreted as aligned with developmental trends and expectations. However, given the nonlinear nature of these scores and the potentially large age differences that may represent average or normal development, it is not possible to make general or standard diagnostic inferences about being below or above one’s chronological age. Rather, age equivalent scores are more likely to be useful in evaluating growth and the intensity of need for instruction and intervention.
Growth Index
An important aspect of measurement, particularly for clinical and educational purposes, is not simply to determine the static level of an attribute but to evaluate changes or growth in the attribute. The Ortiz PVAT Growth Index was designed to provide an indication of the rate of growth of an individual’s receptive vocabulary acquisition from one test administration to another. Vocabulary acquisition is expected to improve as age and exposure to English increase with time.
It is important to note that standard scores convey information about an examinee’s relative standing (i.e., their performance compared to the average performance of same-age peers in the normative sample). Consider, for example, an 8-year-old who obtained a standard score of 100 (50th percentile rank). One year later (at age 9 years), the child was retested and obtained a score of 100 (50th percentile rank). Although the child’s standard scores and percentile ranks were unchanged, growth must have occurred if scores as an 8-year-old were consistent with those of other 8-year-olds, as well as consistent again with other 9-year-olds one year later. As a result, if the examinee maintains an average level of performance upon re-administration each year, their standard score will remain in the Average range (e.g., a standard score of 100 or percentile rank of 50). Although this result clearly indicates that the examinee’s vocabulary acquisition has increased at the average rate for their age (and exposure to English, for English learners), this pattern of unchanged standard scores over yearly administrations might be incorrectly viewed as a lack of growth. Since assessing change over time by relying solely on standard scores or percentile ranks can pose a challenge during interpretation, a different index is necessary.
The Growth Index provided by the Ortiz PVAT is specifically intended to be used to evaluate vocabulary growth. The Growth Index is only available on the Progress Report and only after at least two administrations to the same individual. The Growth Index values are used to compare growth that occurred between adjacent administrations, as well as overall growth that may have occurred from the earliest to the latest administration.
The computation of the Growth Index involves comparing the difference in age equivalent scores from one administration to another, minus the difference in time between administrations. The Growth Index is calculated with the following formula:
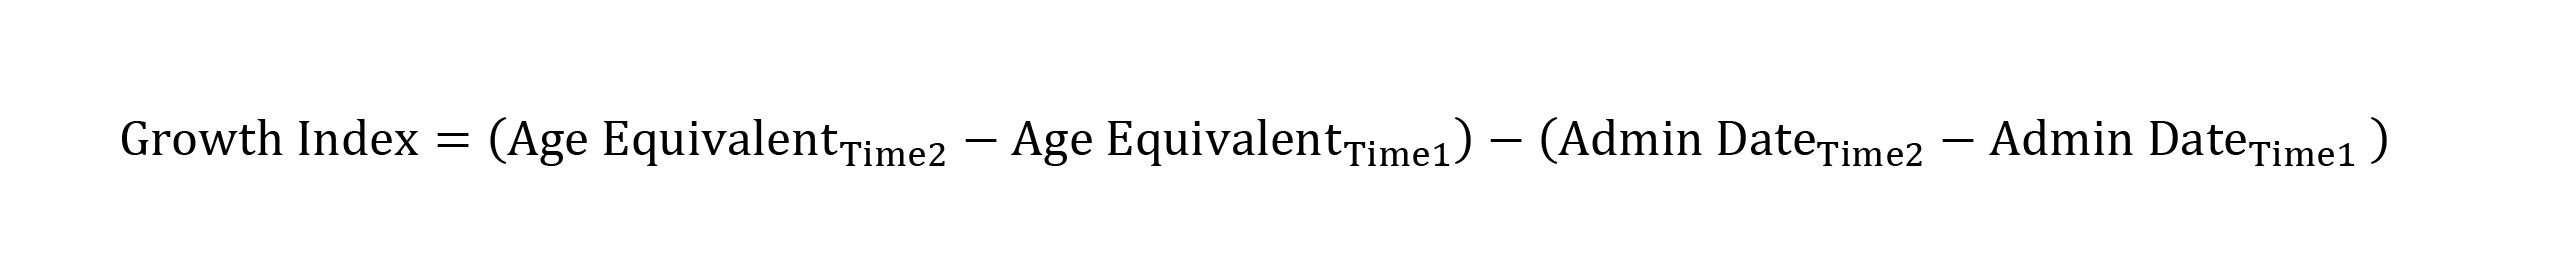
Using this method, values for the Growth Index are centered at a score of 0 and range from -1.00 to 1.00. It is important to note that anchoring the midpoint at 0 permits negative values to be indicative of lower degrees of expected growth, while positive values indicate higher degrees of growth over time. Exact values or values beyond this range can be calculated using the formula above; however, for ease of interpretation, presentation, and use, the range of scores for the Growth Index was truncated at ±1.0, which provides sufficient information to guide evaluation of progress and growth.
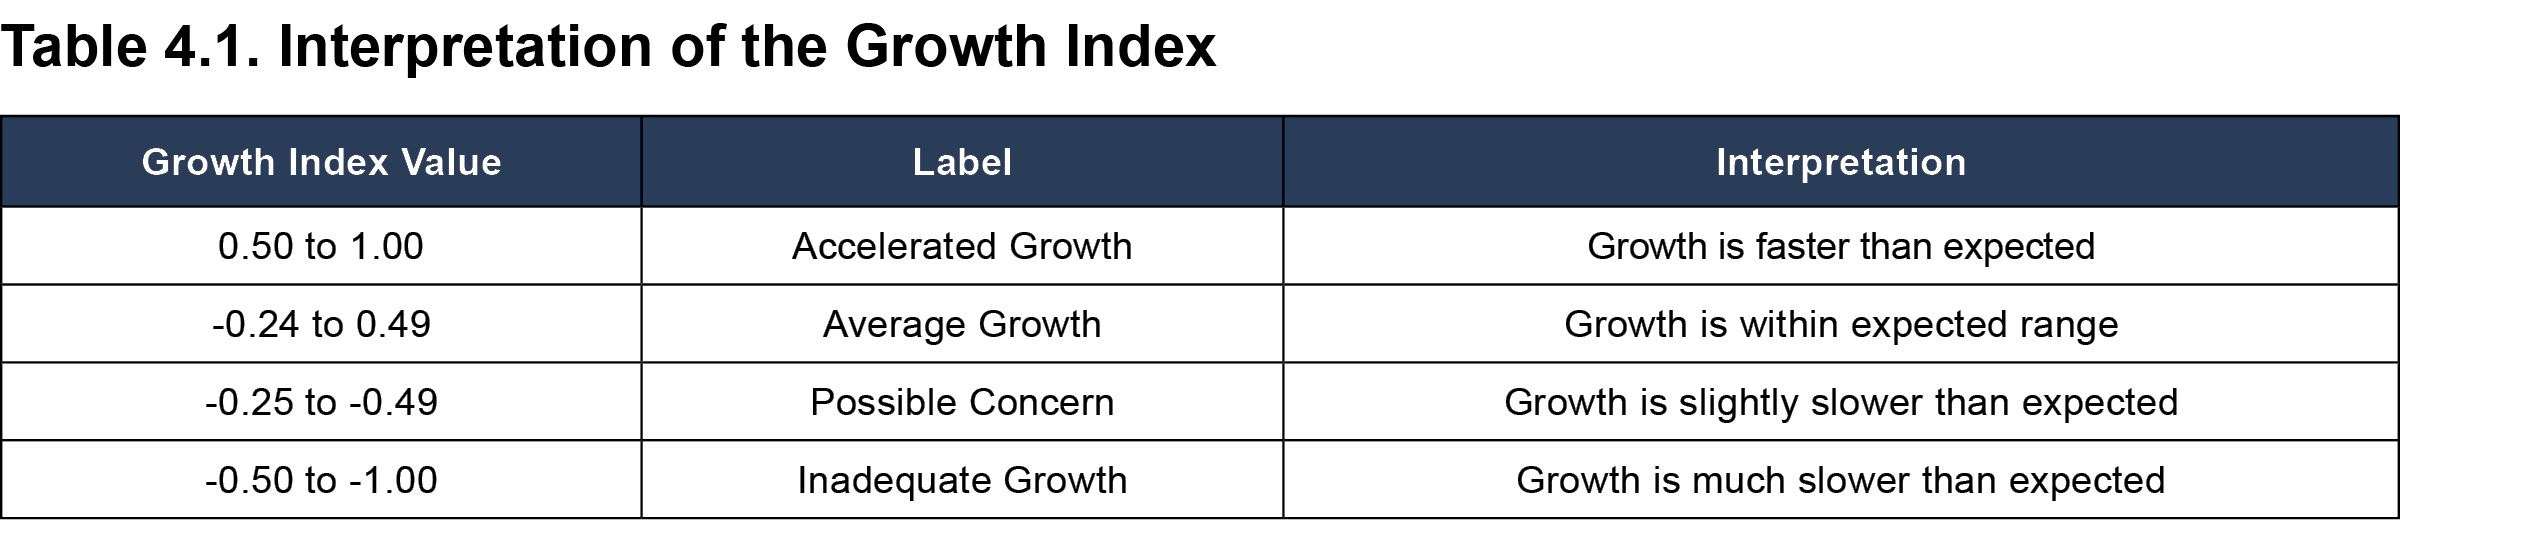
Interpretation guidelines and categories for the Growth Index are provided in Table 4.1. For example, if an examinee’s age equivalent score increases by 1 year (e.g., age equivalent score is 8 years 0 months [8:0] at the first administration and 9 years 0 months [9:0] when tested one year later), their Growth Index would be 0.00. In other words, the examinee’s scores increased by the equivalent of one year, and one year of time passed between administrations. As a result, the rate of growth is exactly as expected during this period of time. Negative values indicate growth that is occurring more slowly than expected (e.g., if the scores increased by the equivalent of two years, but three years have actually passed). On the other hand, positive values indicate accelerated growth, or growth at a rate beyond what is expected (e.g., if scores increased by the equivalent of two years, but only 10 months have passed). This does not mean, however, that concern is warranted whenever the Growth Index is negative. It is not unusual for an individual to display slightly less or more growth from one year to the next. Moreover, when an examinee is already performing in the High, Very High, or Extremely High range, and the rate of growth is slower than expected, the examinee is still performing very well compared to their peers). Thus, only when the magnitude of the Growth Index exceeds these general guidelines, or when the examinee is exhibiting a low level of vocabulary acquisition, should there be cause for concern.
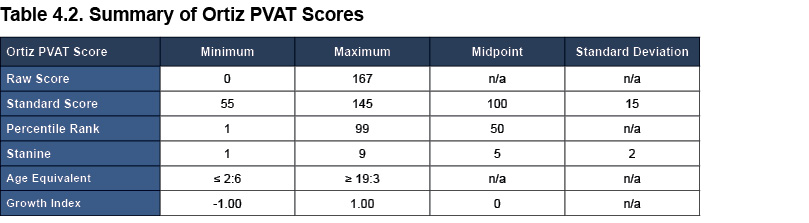
Summary of Ortiz PVAT Scores
The Assessment Report and Progress Report provide evaluators with a number of scores to evaluate an examinee’s performance on the Ortiz PVAT. Details about the available types of scores are provided in Table 4.2 for reference. Note that a 95% confidence interval is always included alongside the reported standard score. In addition, the Growth Index is only reported in the Progress Report, as it cannot be calculated until there have been two administrations to the same individual.