
 |
 |
 |
 |
 |
Standardization Procedures |
To best capture the important relationship between age and scores on the Ortiz PVAT, continuous norming was selected as the method for creating normative scores. Through this regression-based method (Roid, 1983; Zachary & Gorsuch, 1985; Zhu & Chen, 2011), the means and standard deviations of the normative age groups were statistically smoothed to mitigate the effects of sampling variability and to better model the progression of vocabulary acquisition across ages. By establishing a line or curve that best fits the data and theory, continuous norming makes efficient use of information from the whole sample rather than drawing upon just one age group at a time (Angoff & Robertson, 1987). Moreover, rather than scoring all individuals in the same year of age as a single age-based norm group, continuous norming enables scores to be calculated at any point along the curve to capture age-related variance within age groups (e.g., differences between those aged 5 years 1 month and 5 years 11 months). Thus, regression-based continuous norming enables greater precision by scoring individuals against more specific and appropriate norms (Zhu & Chen, 2011).
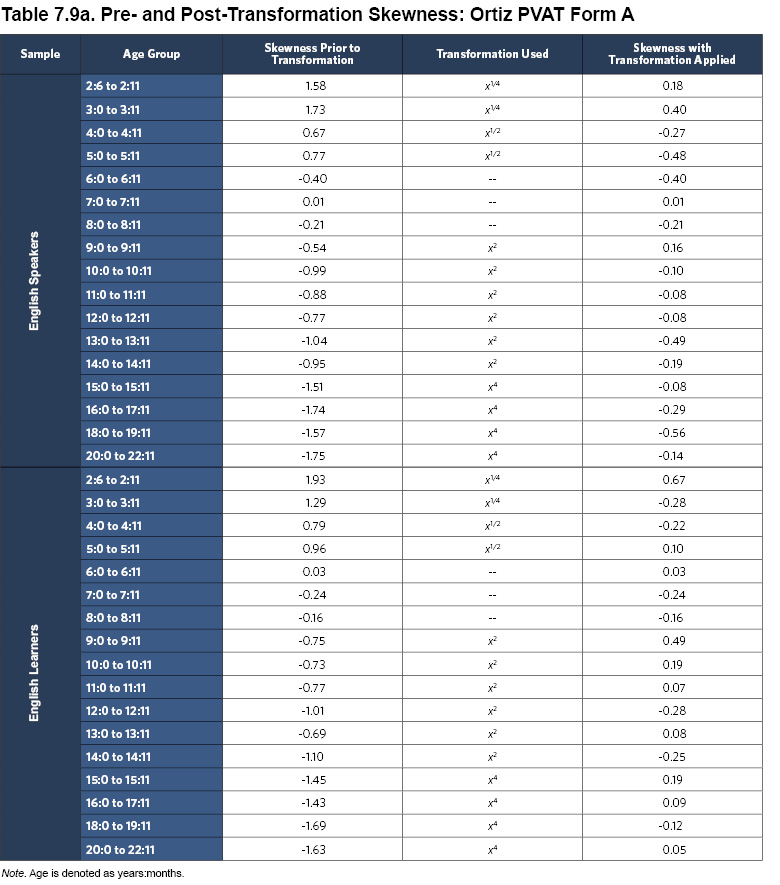
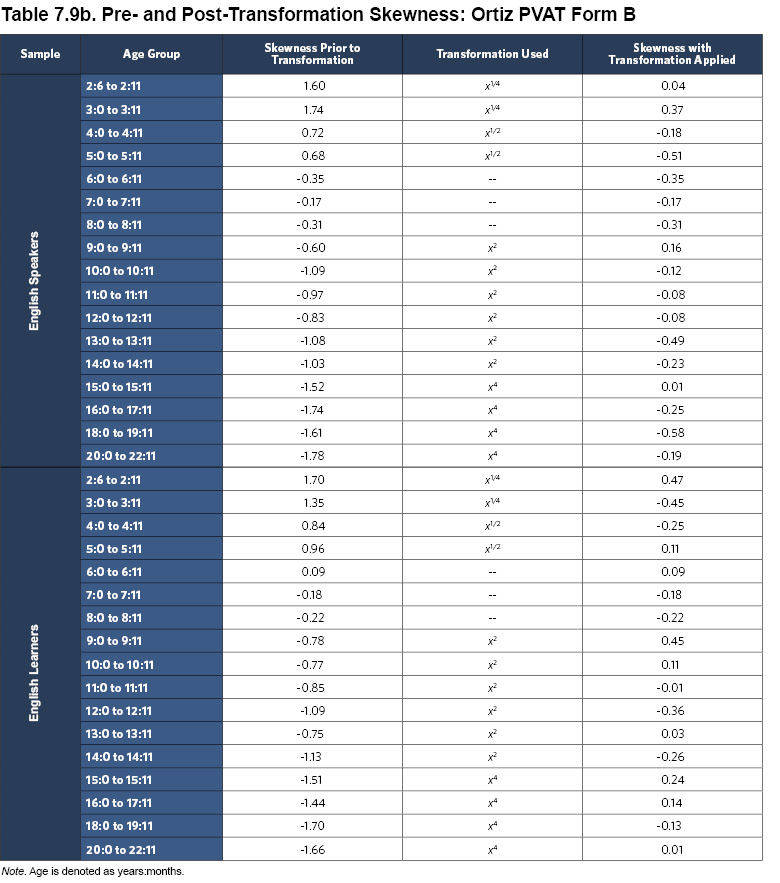
For the English Speaker normative sample, a clear curvilinear trend was identified between age and raw scores on the Ortiz PVAT. First, within each age group, some skewness was observed, producing floor and ceiling effects. To attenuate these effects, a set of power transformations was applied, successfully reducing the skewness (see Tables 7.9a and 7.9b; Lenhard, Lenhard, Suggate, & Segerer, 2016). The regression-based continuous norming method was applied to the transformed means, producing an equation for the best fitting line that effectively smoothed the group means across ages (R2 = .988; age and age2 predictors were significant at p < .001).
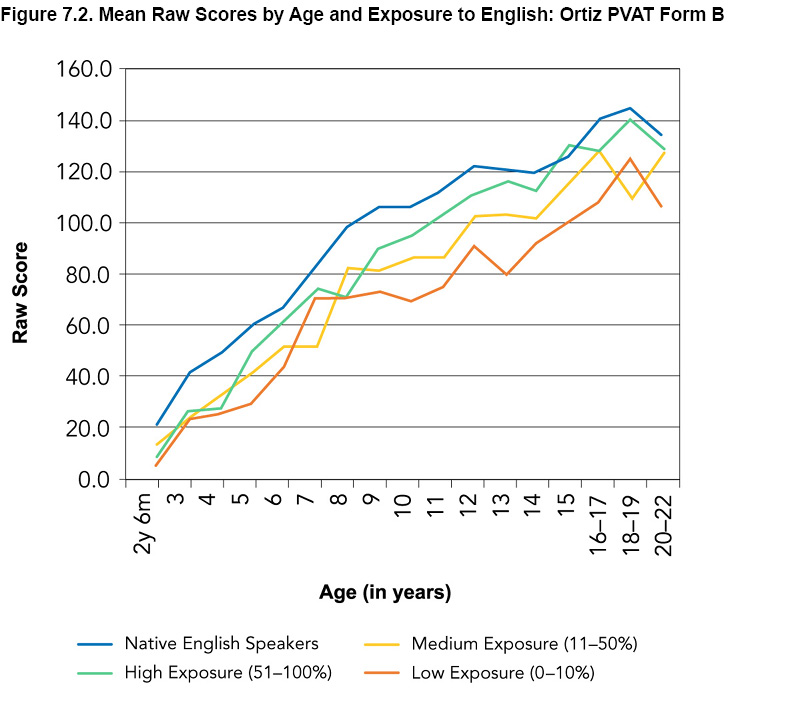
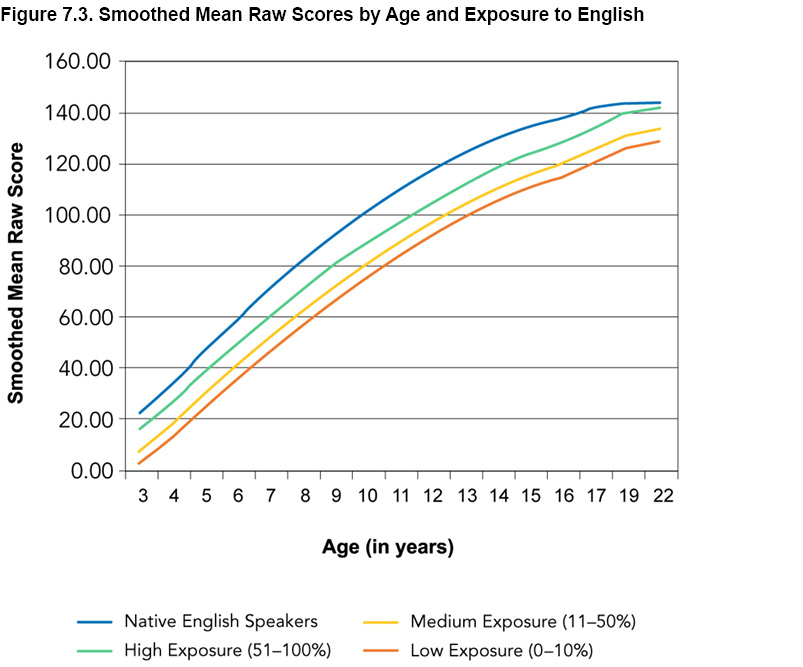
The means (using the age-appropriate power transformation) from before the continuous norming method was applied are presented in Figures 7.1 and 7.2; Figure 7.3 presents the means from after the continuous norming method was applied. Note that Figures 7.1 and 7.2 illustrate results from Form A and Form B, while Figure 7.3 illustrates calculations that were used in algorithms that applied to both forms. A comparison of Figure 7.1 and Figure 7.3 shows how the continuing norming method has improved the norm value accuracy by smoothing out the slight sampling variation. The regression equation generated through continuous norming was then used in the scoring process to calculate the predicted mean for an individual’s exact age.

Identical power transformations were applied to the scores of the English Learner normative sample. These transformations worked effectively to reduce skew (see Tables 7.9a and 7.9b), and the use of the same transformations ensures comparability with the English Speaker sample scores. The regression model for the English Learner sample incorporated proportion of life exposed to English, as age alone did not explain all of the variance in the scores and the inclusion of exposure to English was both theoretically and statistically meaningful (R2 = .975; age, age2, and percentage of exposure to English were all significant predictors at p < .01). By including exposure to English in the equation, the English Learner normative sample model explained a comparable amount of variance to the English Speaker normative sample model, which provides empirical support for accounting for exposure.
No developmental trend by age was identified for the standard deviations of the raw scores; therefore, empirical values of the pooled English Speaker and English Learner normative samples were used to compute standard scores in both samples. After computing the standard scores, an iterative series of slight smoothing adjustments was applied to further smooth the values, reduce the effect of sampling variability, and optimize the range of possible scores. The final standard scores were based on age (for English Speaker and English Learner normative samples, respectively) and exposure to English (for the English Learner normative sample only), using continuous norming and smoothing methods. The scores were standardized to M = 100 and SD = 15 within each normative sample; the average standard score within each age group was not significantly different from 100 (p < .01), and the lack of statistically significant difference validates the use of continuous norming in these samples. Standard scores for English speakers and English learners were truncated to a minimum of 55 and a maximum of 145 for both normative samples to aid in interpretation. A final small adjustment was made to ensure standard scores for English learners using the English Learner norms would not exceed their standard scores when calculated with the English Speaker norms. Scores for the Ortiz PVAT Form A were used to develop the standard score algorithm for both samples, and the process was validated with the scores for the Ortiz PVAT Form B.
| << Description of Normative Samples | Chapter 8: Overview >> |