
 |
 |
 |
 |
 |
Reliability |
Measurement error is an inevitable feature of any measurement activity that must be taken into account. In classical test theory (CTT), any observed score is equal to the true score of the attribute being measured plus measurement error (Lord & Novick, 1968; MacKenzie, Podsakoff, & Podsakoff, 2011). According to modern test theory, or Item Response Theory (IRT), reliability refers to the precision (also referred to as the amount of information) that an item affords about the latent or underlying construct being measured (Ayearst & Bagby, 2010). A reliability coefficient is used to describe the amount of measurement error or precision, and it is defined as the consistency of measurement obtained across different administrations or parts of the instrument (AERA, APA, & NCME, 2014). Reliability can be conceptualized and measured in a number of ways; however, a common interpretation is that the reliability of an instrument describes how consistent the scores are. Multiple indicators of reliability are provided for the Ortiz PVAT, including alternate form reliability, internal consistency, item and test information, and test-retest reliability.
Alternate Form Reliability
Two versions of the Ortiz PVAT, Form A and Form B, were developed as parallel measures of receptive vocabulary acquisition (for information about alternate form use, see chapter 3, Administration and Scoring; for information regarding construction of the two forms, see chapter 6, Development). After a careful development process to ensure that the two versions were parallel, the reliability of scores from the alternate forms was investigated in the normative samples to ensure consistency of scores across forms.
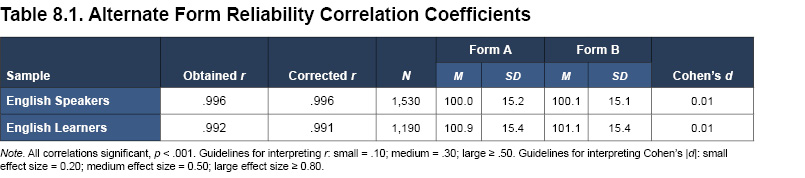
Standard scores were computed for both forms within the English Speaker and English Learner normative samples. The alternate form reliability coefficient, as measured by Pearson’s correlation coefficient, was also calculated separately for each sample. Observed correlations, as well as correlations that were corrected for variability and range restriction (using Thorndike’s [1949] case 2 correction method), are summarized in Table 8.1. For both normative samples, the alternate forms demonstrated very high, positive correlations (corrected r = .991 for English speakers and .996 for English learners; all coefficients significant at p < .001). Table 8.1 also shows the means and standard deviations of the alternate forms, as well as the standardized mean differences between alternate forms (Cohen’s d effect size ratios, which represent the differences between the means divided by the pooled standard deviation; Cohen, 1988). The mean difference between Ortiz PVAT scores obtained across the two alternate forms was negligible (Cohen’s d effect size = 0.01 for both samples). These results provide considerable evidence for exceptional alternate form reliability of the Ortiz PVAT. Furthermore, these findings support the parallel nature of the two forms; scores from either form can be considered reliable and be used interchangeably, or as a tool to track progress over time (as described in more detail in chapter 3, Administration and Scoring).
Internal Consistency
Internal consistency is an indicator of reliability that refers to the interrelatedness of the items on an assessment. It is a meaningful metric when the assessment is unidimensional, such that all the items are believed to be theoretically interrelated due to a shared association with an underlying trait or factor measured by the assessment.
A measure of overall scale reliability in the IRT framework is marginal reliability (Yang, Hansen, & Cai, 2012). Within the IRT framework, information is gathered regarding the measurement error of each item across the entire scale. However, analogous to coefficient alpha1, the marginal reliability estimate condenses the item-level error and variability into a single value, rather than accounting for the item-level differences in precision throughout the assessment. Similar to the interpretation of coefficient alpha, scores above .80 indicate sufficient reliability, while scores closer to 1.0 indicate very high reliability (Bracken, 1987). Unlike coefficient alpha, a marginal reliability coefficient is unaffected by test length (John & Benet-Martínez, 2000). Instead, it provides point-estimates of error along the whole continuum of receptive vocabulary ability and averages those estimates into a single value for ease of interpretation.
To compute marginal reliability coefficients for the normative samples, English speakers and English learners were pooled together (N = 2,720; see chapter 7, Standardization, for a description of the normative samples), following the same procedure that was used when fitting the IRT model (from which the Ortiz PVAT scoring was derived). The marginal reliability coefficient of the Ortiz PVAT is .98 (for both Form A and Form B). In addition, the marginal reliability coefficient for the clinical sample (see Relation to Clinical Diagnoses in the Validity section of this chapter for more information about the sample), for both Form A and Form B, is .99. These results provide evidence of excellent internal consistency for the Ortiz PVAT.
Special Topic: Practical Applications of Internal Consistency Values–
|

Item and Test Information
Another element of the IRT framework for understanding reliability is through the examination of item and test information (Ayearst & Bagby, 2010). Each item provides a certain amount of information, depending on both the item’s difficulty and discrimination parameters. A higher amount of information indicates greater measurement precision, and the amount of information an item affords may vary across various levels of the latent trait (e.g., a very easy item may be informative for those with low ability, but may provide no information about those with higher ability who are very likely to answer correctly). A higher amount of information (or precision) in the items increases the test’s ability to accurately measure and differentiate between varying degrees of examinee performance. As described in chapter 6, Development, items with low information (i.e., below 0.30) were flagged for removal from the Ortiz PVAT due to higher error and lower reliability.
Item information is summative, such that it can be added up across all the items on a test to provide an overall test information function. The test information function is a graphical representation of the precision of the test across all levels of the construct being measured. The inverse of test information is the SEM; that is, the least amount of error in a set of items is at the point where the most information is provided (Ayearst & Bagby, 2010; Embretson & Reise, 2000). A test information graph demonstrates the range of ability levels for which the assessment is the most precise with the least amount of error.
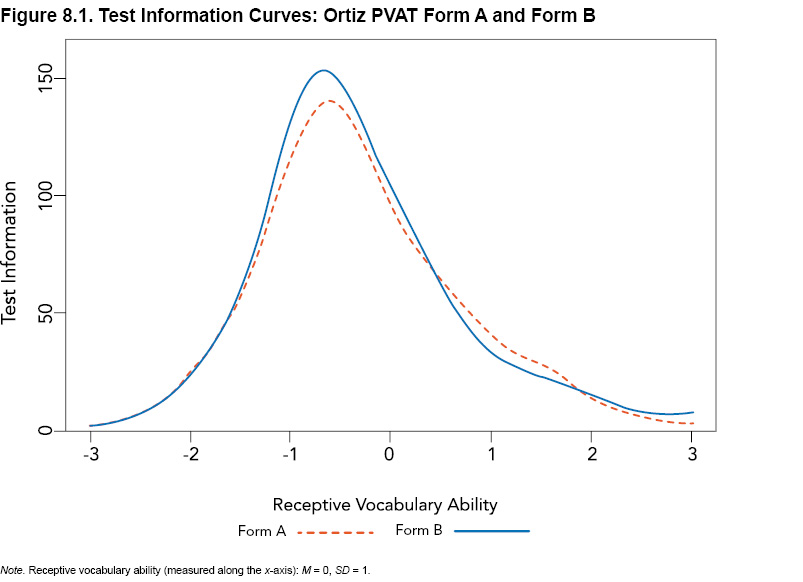
An analysis of test information was conducted on the pooled normative sample of both the English Speaker and English Learner normative samples (N = 2,720), as the IRT model from which the value was derived comprises both samples. As seen in Figure 8.1, both Form A and Form B of the Ortiz PVAT show a high peak that is not particularly narrow. In other words, both forms offer a large amount of information (depicted as higher values along the y-axis) across a wide range of receptive vocabulary ability (represented along the x-axis; standardized to M = 0, SD = 1). Information is lower, and therefore error is greater, as the test information curve reaches into extreme ranges (i.e., more than 3 standard deviations above or below the mean). As items on the Ortiz PVAT are designed to assess a wide range of ability levels, the amount of information provided at many points along the continuum of ability is promising. However, even for notably low receptive vocabulary ability (e.g., x-axis values between -3 and -2), the Ortiz PVAT provides a considerable amount of precision (i.e., test information > 10). Information values of 10 correspond to standard error values of .32; this amount of information indicates high precision and, in turn, corresponds to reliability coefficients of .90 (Flannery, Reise, & Widaman, 1995), which is well above typical guidelines for acceptable levels of reliability and error. The spread of the test information curves provides support for the precision of the Ortiz PVAT; error is low and precision is high throughout much of the continuum of ability. Furthermore, the shape of the test information curves presented in Figure 8.1 for Form A and Form B are very similar, providing additional support for the parallel nature of the forms.
Test-Retest Reliability
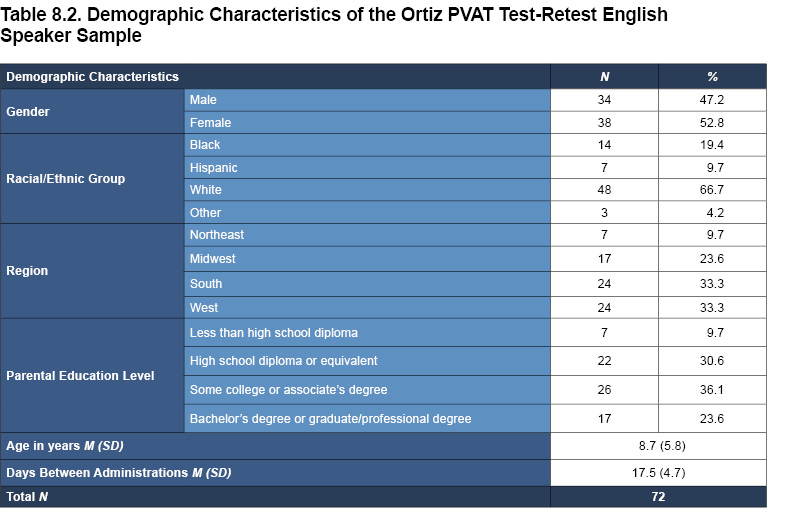
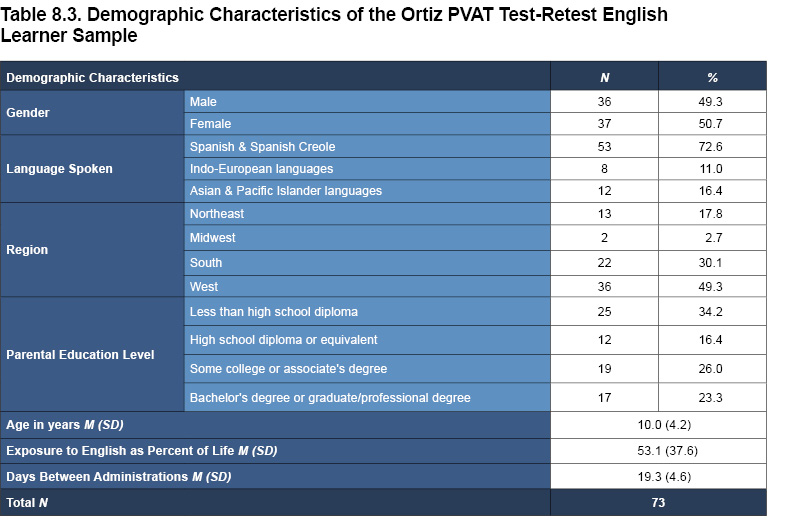
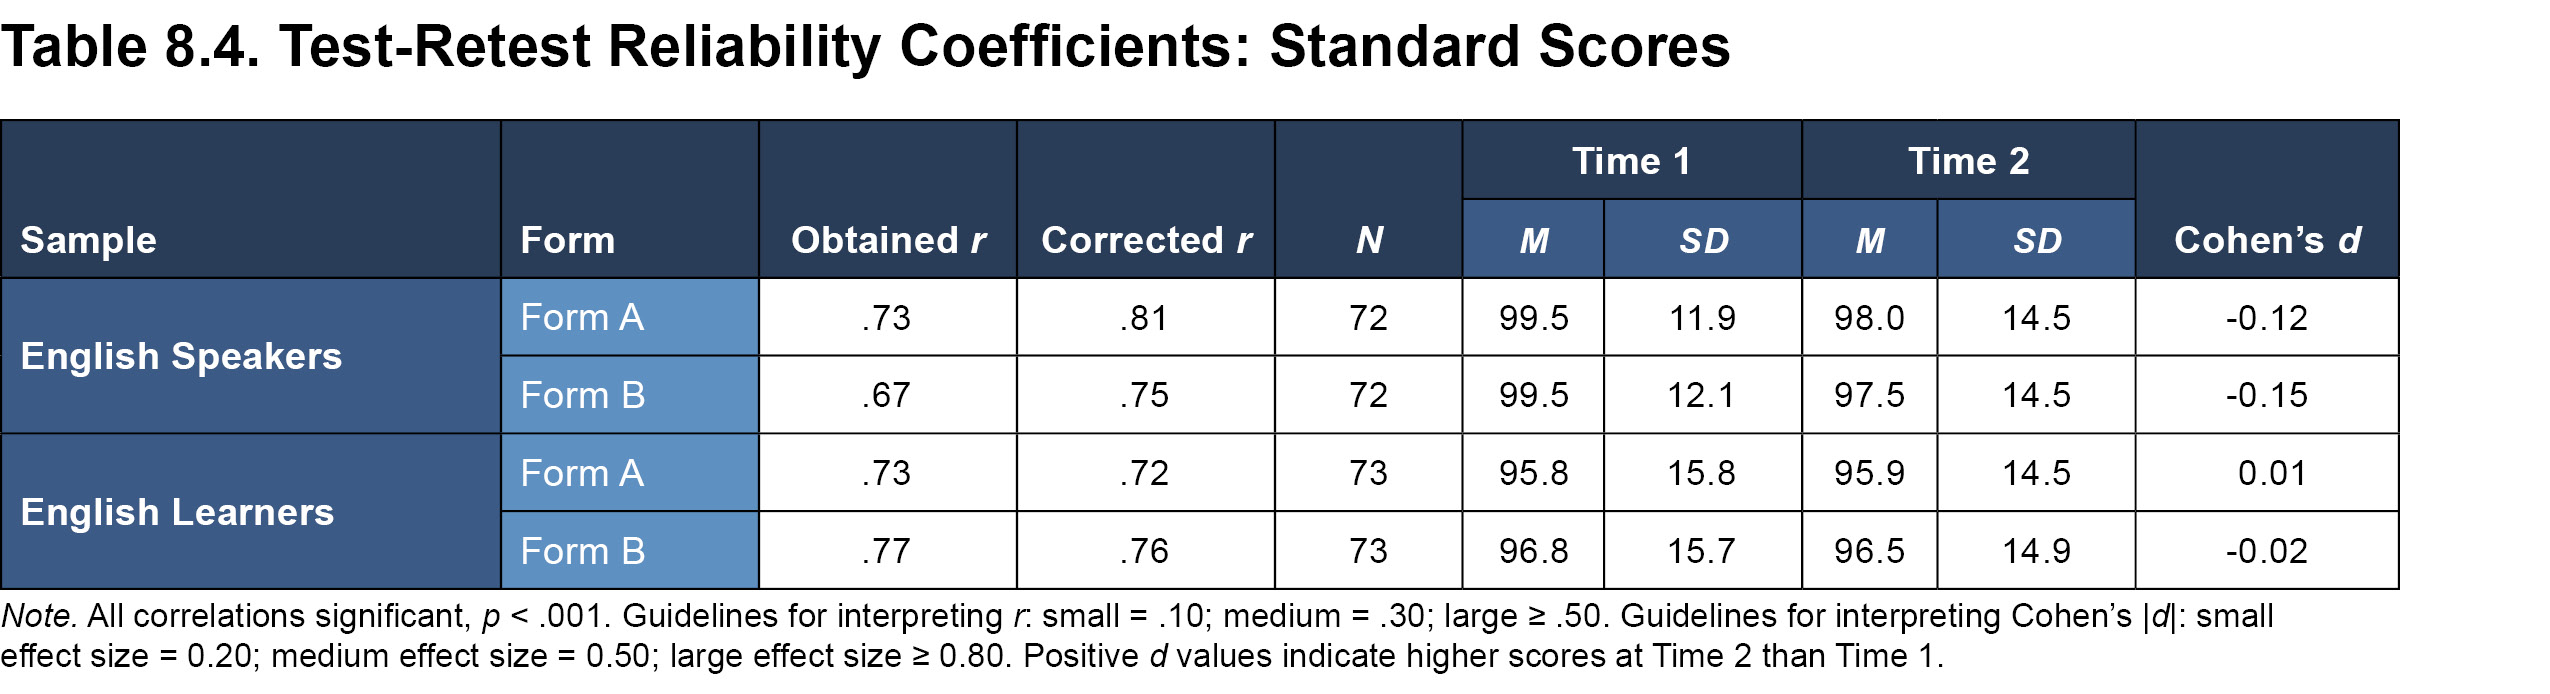
Test-retest reliability refers to the degree of relation between scores obtained on two separate occasions for the same individual over a fixed period of time. Measures with stable scores, such as those with high precision and reliability, are expected to have high correlations, indicating little change in scores from one administration to the other. The test-retest reliability of the Ortiz PVAT was assessed by computing the correlation of standard scores obtained on two separate administrations over approximately a 2- to 4-week interval (i.e., 13 to 31 days; see Tables 8.2 and 8.3 for demographic characteristics of the English speaker and English learner test-retest samples). Correlation coefficients were adjusted using Thorndike’s (1949) case 2 correction method.
The obtained correlations, as well as those corrected for restricted range and sampling variability, are provided in Table 8.4. The results provide evidence for the strong test-retest reliability of the Ortiz PVAT as correlations across administrations were high and positive (English speakers corrected r = .81 for Form A and .75 for Form B; English learners corrected r = .72 for Form A and .76 for Form B; all p < .001). Table 8.4 also show the means and standard deviations at Time 1 and Time 2, as well as the standardized mean differences between administrations (Cohen’s d effect size ratios). As further evidence of score stability over the course of the re-test period, the difference between the mean Ortiz PVAT scores obtained across the two administrations was negligible (Cohen’s d effect size ranged from 0.01 to -0.15). Given the strong evidence for test-retest reliability, these results can also be used to inform instances of multiple administrations, perhaps to measure growth over significant periods of time, or to gauge changes attributable to teaching methods or interventions designed to increase vocabulary. The stable nature of the scores, as demonstrated by the test-retest reliability coefficients, should provide confidence that any change observed in an individual’s score over time is more likely due to a true change in performance, as opposed to imprecise measurement.
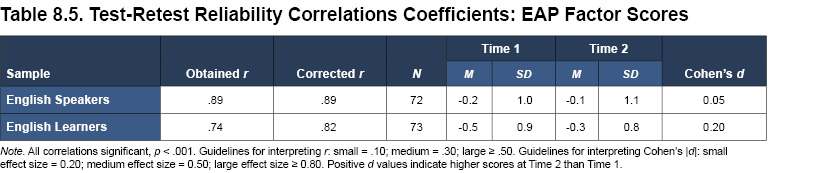
In addition to comparing standard scores between repeat administrations, the IRT-based ability estimates were also compared between Time 1 and Time 2. The IRT-based ability estimate is termed an “expected a posteriori” (EAP) factor score, as it provides an estimate of each individual’s level of the factor or underlying construct (i.e., receptive vocabulary acquisition and ability; Embretson & Reise, 2000). Based on the pattern of responses to the test items, the IRT model provides a score estimate for each examinee’s receptive vocabulary ability that is standardized and on the same metric as IRT item difficulty and location. EAP factor scores are normally distributed (M = 0, SD = 1) and typically range within three standard deviations from the mean (i.e., -3 to 3; Embretson & Reise, 2000).
As shown in Table 8.5, the test-retest correlation coefficient for the EAP factor scores was calculated for both the English speaker and English learner test-retest samples. Both samples demonstrated very high, positive correlations (corrected r = .89 and .82 for the English speakers and English learners, respectively; all p < .001). Moreover, the mean difference between the EAP factor scores obtained across the two administrations was negligible (Cohen’s d effect size ranged from 0.05 to 0.20). These results indicate that the underlying ability (i.e., receptive vocabulary) measured by the assessment is being measured consistently at both time points, displaying strong evidence of reliability for the Ortiz PVAT.
1For interested readers, coefficient alpha, a common metric used in CTT, was also calculated for the Ortiz PVAT (Cronbach, 1951). Across Form A and Form B, coefficient alpha values were .99 for both normative samples (i.e., English Speakers and English Learners) and for the clinical sample. The extremely high coefficients observed are a function of both the length of the test (167 items on each form), as well as how consistently the items within each form are measuring the same, unified construct.
| << Overview | Validity >> |